Adding a chart to a dashboard
To add a chart to a dashboard:
In the left-hand panel, click Dashboards and select the dashboard you need. If you do not have a dashboard, create one.
At the top of the page, click Edit.
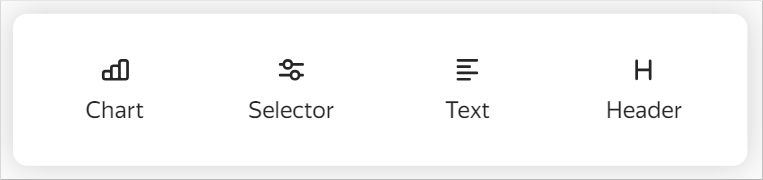
In the panel at the bottom of the page, select Chart.
Specify the widget settings. Pay close attention to the following fields:
Name: Sets the name of the widget. If the Show option is enabled (by default), the name is displayed at the top of the widget.
Chart: Sets the widget to add. Select a chart:
From the list of objectsVia a linkClick Select. Select the desired chart from the list of objects. If the chart is already selected, you can proceed to edit it. To do this, click Open to the right of the chart.
Click Specify link. Enter the chart URL in the input field. Click OK on the right.
Description: Sets the description of the widget. It is displayed at the bottom of the widget.
Auto height: Sets the automatic height for the Table widget type. If this parameter is disabled, you can set the height of the widget on the page using the mouse.
(Optional) Under Parameters, list chart parameters and set their default values. If the default values are not set, an error will be displayed on the dashboard.
Click Add. The widget will be displayed on the dashboard.